The use of DNA to help determine someone’s ethnicity is now pretty well established. Models used to estimate ethnicity continue to improve leading to greater and greater accuracy. Each company has their own model and their own way of grouping locales, which makes it difficult to determine who is the “best”. I have had my DNA tested by three different companies and submitted my DNA results from those companies to two others. Based on the analysis of all the results, I can roughly break my ethnicity down into six areas.
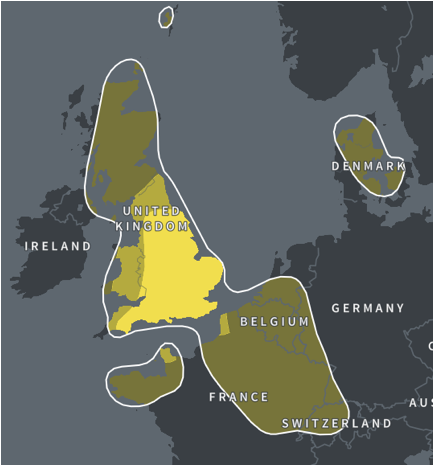
British Isles: The value across all of the services puts this group at anywhere from 60 to 80%. Based on my own research I feel confident that I can rank the countries in this order: England, Scotland, Ireland, and Wales. Both of my parents contribute to this group.
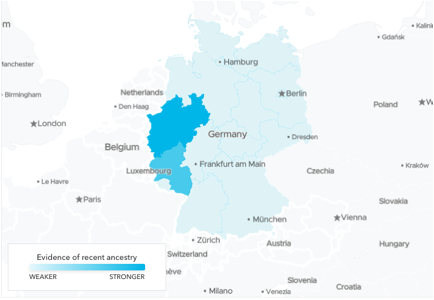
West & Southwest Germany and North/West/Central Europe: Most companies list this group as West/Central Europe, which includes the countries of Southwest Germany, Switzerland, western Austria, western Slovenia, northeast France, Belgium, Netherlands, Luxembourg, and Liechtenstein. Two companies are very specific, listing only the North Rhine-Westphalia and the Rhineland-Palatinate areas of Germany. Those companies who list only Germanic Europe show 5-12%. Those who list the broader areas show 20-50%. Based on my mother's known DNA, she does not contribute any to this ethnicity. All of this comes from my father's side.
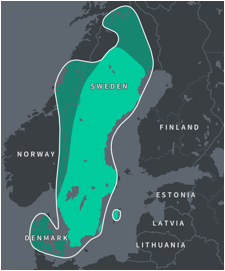
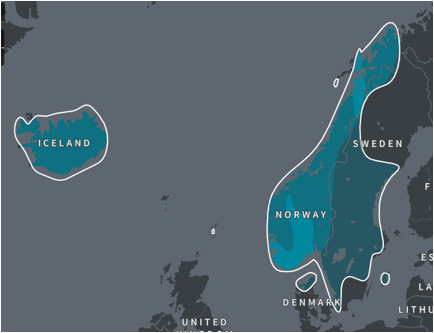
Scandinavia: This group includes the countries of Norway, Sweden, Denmark, and Iceland. While some include Finland, most do not. Based on my research I carry Swedish, Danish, and Norwegian DNA. Most of my Norwegian, if not all, comes from my mother (based on her DNA results), while all of my Swedish comes from my paternal grandmother’s (Robbins) side. This group roughly represents 6-17% of my ethnic makeup.
At one time one of the companies listed me as 0.7% Finnish, but on their last update it was removed, and another has me listed as 1.7%. I have found a great-grandfather from Finland who moved to Sweden where all of his children were born and raised. I do have some autosomal matches with Finish individuals living in Finland (at least 70 individuals so far).
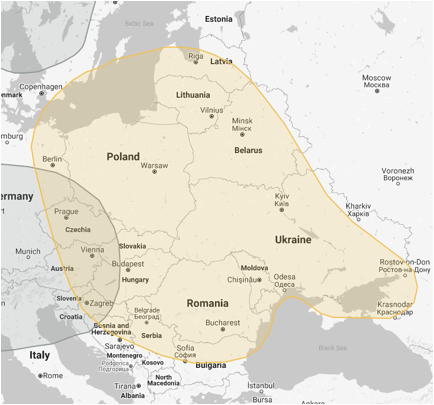
Eastern Europe: This group includes the countries of Poland, Russia, Belarus, Ukraine, Estonia, and Lithuania. My y-DNA (male) analysis shows some connections to a handful of individuals from Russia, Ukraine, and Poland. One independent researcher has maintained as early as 2006 that our Eastern European ancestry probably was centered in Slovakia, which is sandwiched between Poland and Hungary. This group roughly represents about 5% (one company has it as high as 16%).
Mediterranean Islands: This group includes the islands of Cyprus, Sicily, Sardinia, and Malta. This group roughly represents 2% of my ethnic makeup.
Sub-Saharan Africa and Native American: While these are two very different groups, they typically make up the remaining “less than 1%”. When specific ethnicities of Sub-Saharan Africa are shown it is Congolese and Angolan.
Based on my research I have found ‘nth’ great-grandparents in the following countries:
England
Scotland
Wales
Ireland
Sweden
Norway
France
Netherlands
Germany
Switzerland
Finland
Native American – Cherokee & Monongahela
I have not found any great-grandparents from Eastern Europe, the Mediterranean Islands, or Sub-Saharan Africa. I believe these connections are ancient and have been greatly watered down over the centuries.
Map 1
The bright yellow area represents the strongest concentrations, which happens to be England proper. The reason for concentrations from other regions is because England had been populated by Anglo-Saxons, Danish Vikings, Norwegian Vikings, Swedish Vikings, and Normans (Northern France) in their past. [Back to top]
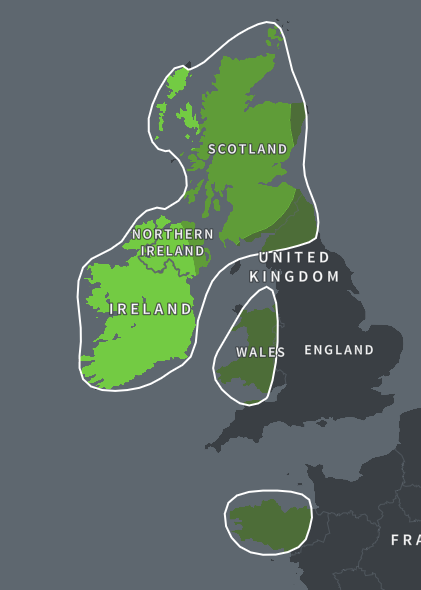
Map #2
This map represents Ireland and Scotland. Ireland and Scotland became intertwined during the Viking raids from AD 800-1000 and then again in the 1700’s when Scots emigrated en mass from English oppression into Ireland. A generation or two later many of those descendants immigrated to America and settled in the Appalachian Mountains and gave rise to the ethnic group known as the Scots-Irish. [Back to top]